

Businessman turning virtual knob measurement from low to high level for Business risk management and analysis assessment concept.
Коллекция по умолчанию
Коллекция по умолчанию
Создать новую
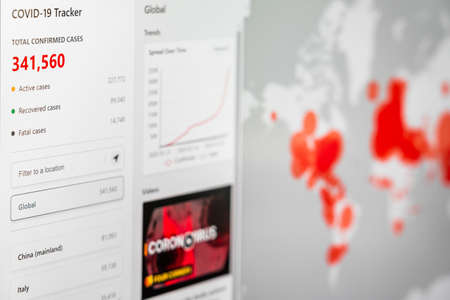
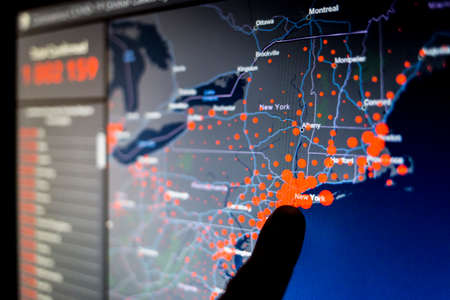
BUCHAREST, ROMANIA - MARCH 23, 2020: Coronavirus Total Cases Of The Pandemic Spreading All Around The Globe In March
Коллекция по умолчанию
Коллекция по умолчанию
Создать новую
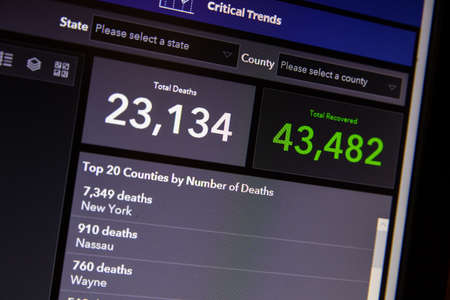
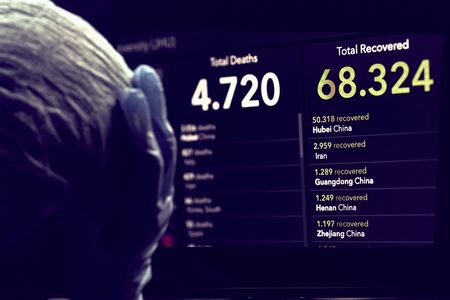
NAMPA, IDAHO - APRIL 14, 2020: John hopkins tracks deaths vs recovery
Коллекция по умолчанию
Коллекция по умолчанию
Создать новую
connections data red
Коллекция по умолчанию
Коллекция по умолчанию
Создать новую

hexagon, risk icon with the word risk. Business concept
Коллекция по умолчанию
Коллекция по умолчанию
Создать новую
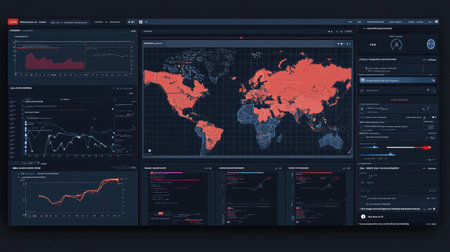
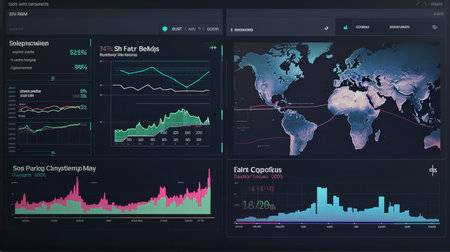
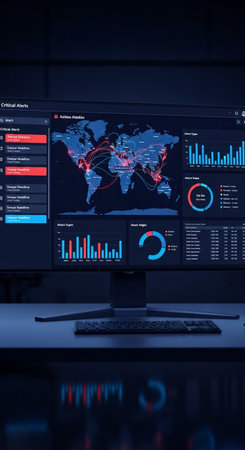
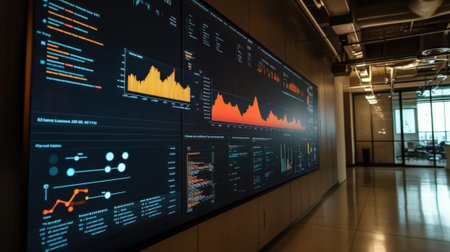
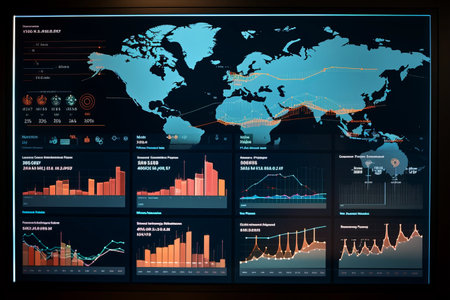
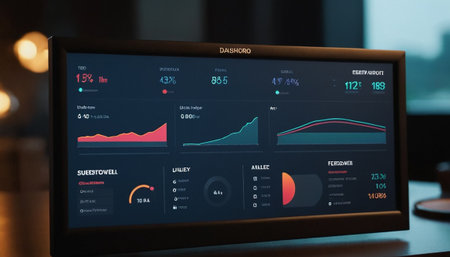
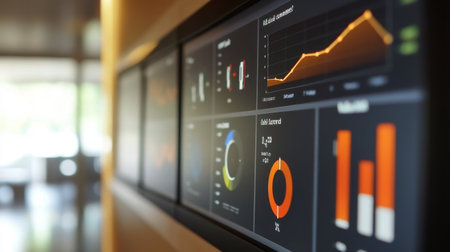
This interactive data analytics dashboard showcases a global map and various charts, designed to visualize business performance and data insights effectively.
Коллекция по умолчанию
Коллекция по умолчанию
Создать новую
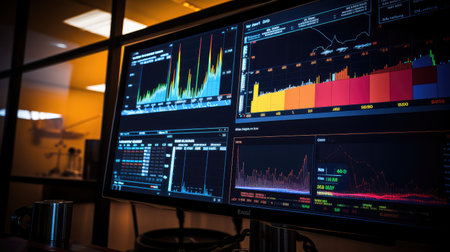
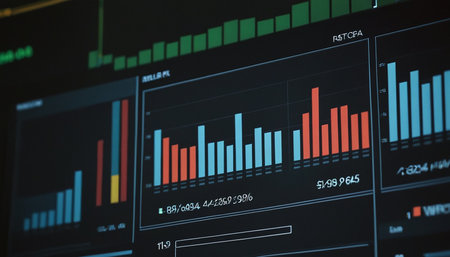
Financial data analyzing on monitor. Abstract financial data analysis on monitor.
Коллекция по умолчанию
Коллекция по умолчанию
Создать новую
charts oil rig data
Коллекция по умолчанию
Коллекция по умолчанию
Создать новую
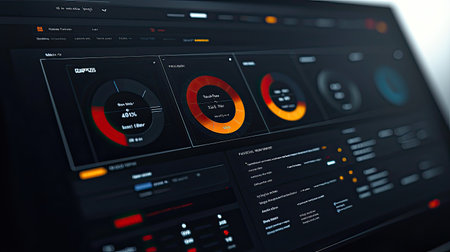
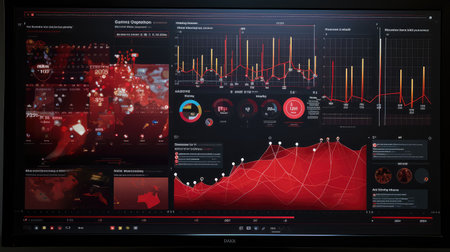
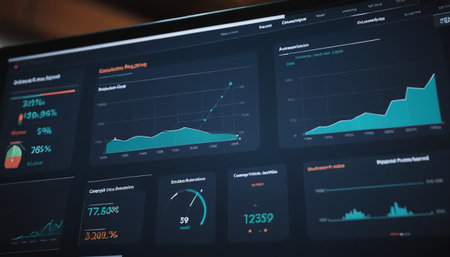
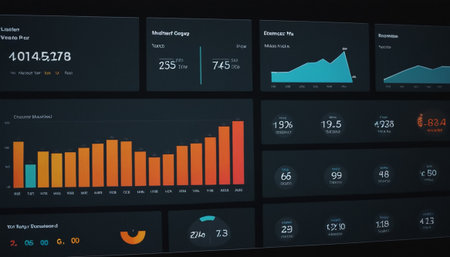
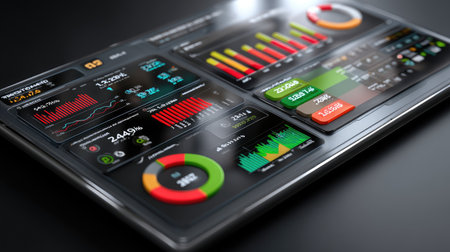
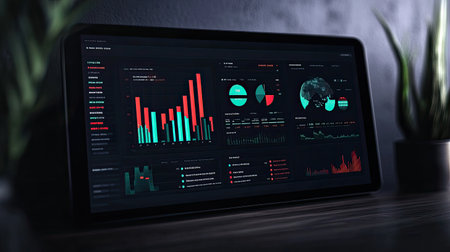
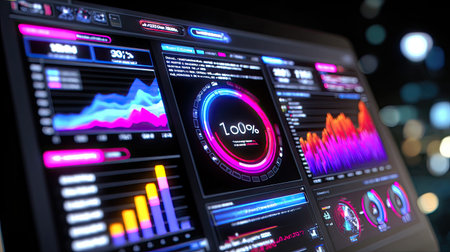
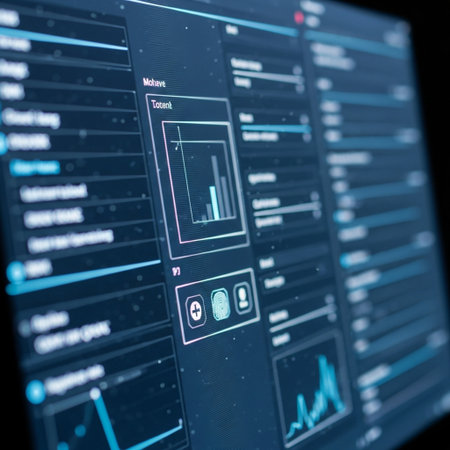
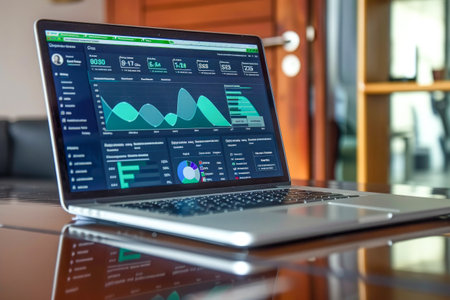
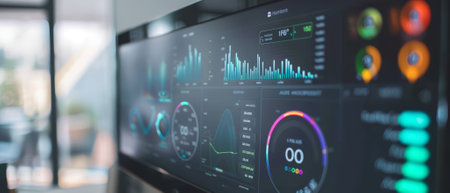
A sleek digital dashboard featuring vibrant data visualizations and user-friendly interface elements, perfect for technology and analytics projects.
Коллекция по умолчанию
Коллекция по умолчанию
Создать новую

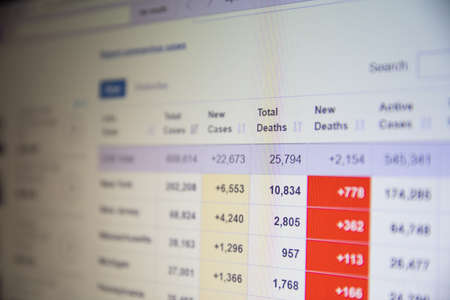
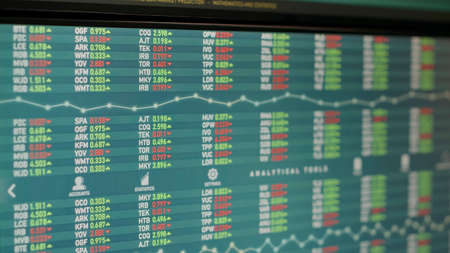
Statistics compare total number of deaths from Corona Virus sorted according to the country name and region.. selective focus
Коллекция по умолчанию
Коллекция по умолчанию
Создать новую
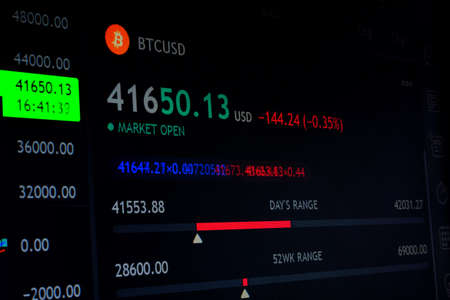
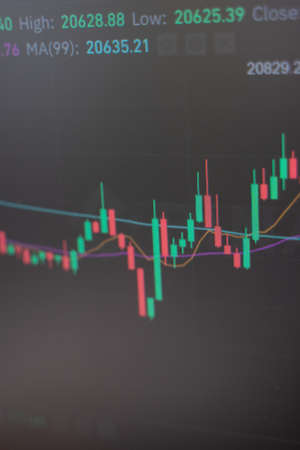
A stock market graph on a black background.
Коллекция по умолчанию
Коллекция по умолчанию
Создать новую
NAMPA, IDAHO - APRIL 14, 2020: Cases of Coronavirus per the John Hopkins website
Коллекция по умолчанию
Коллекция по умолчанию
Создать новую

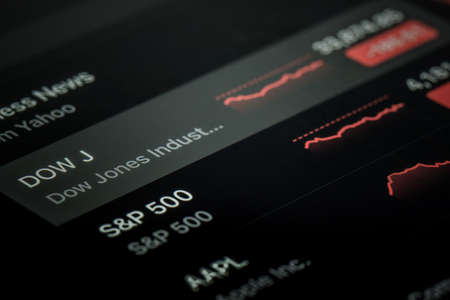
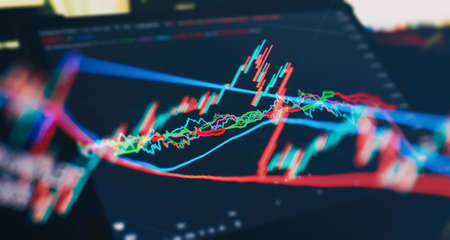
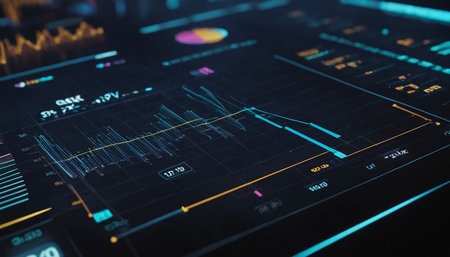
Shallow depth of field (selective focus) with details of a chart showing the stock market crash from March 2020 due to the Covid-19 pandemic on a computer screen (S&P500 index)
Коллекция по умолчанию
Коллекция по умолчанию
Создать новую
A timeline chart showing events and milestones over time AI generated
Коллекция по умолчанию
Коллекция по умолчанию
Создать новую

Closeup of a red needle on a risk meter, highlighting tension, alert and measurement in a detailed instrument dial.
Коллекция по умолчанию
Коллекция по умолчанию
Создать новую
NAMPA, IDAHO - APRIL 14, 2020: Number of deaths as per worldometers website
Коллекция по умолчанию
Коллекция по умолчанию
Создать новую

The Stock Exchange, Streaming Trade Screen, The stock screen Show the stock price rise.
Коллекция по умолчанию
Коллекция по умолчанию
Создать новую

Risk and business management concepts with text on wood box on laptop.copy space
Коллекция по умолчанию
Коллекция по умолчанию
Создать новую
A computer screen displaying a detailed map of the world, showing continents, countries, and geographical features.
Коллекция по умолчанию
Коллекция по умолчанию
Создать новую
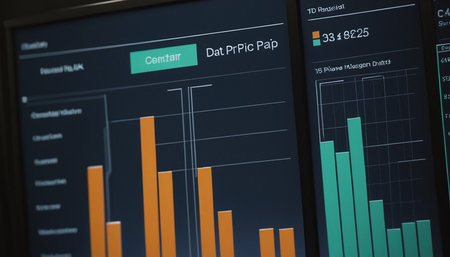
Stock Market Trading Chart Investment Analysis Business Index Chart Finance Board Chart
Коллекция по умолчанию
Коллекция по умолчанию
Создать новую
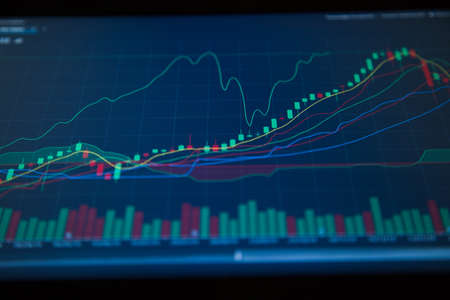
Stock market data on monitor screen. Abstract stock market data background. Stock market data on monitor screen. Business financial graph on monitor. Stock market data on monitor.
Коллекция по умолчанию
Коллекция по умолчанию
Создать новую
Laptop with the chart on screen. Business and finance concept
Коллекция по умолчанию
Коллекция по умолчанию
Создать новую
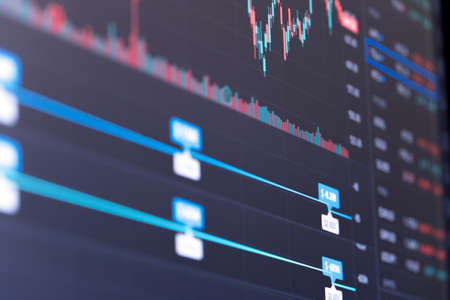
Financial stock market graph. Stock Exchange. Selective focus.
Коллекция по умолчанию
Коллекция по умолчанию
Создать новую

Hand opened blue rocket with alphabet building the word RISK. The concept of risk assessment of takes off startup
Коллекция по умолчанию
Коллекция по умолчанию
Создать новую
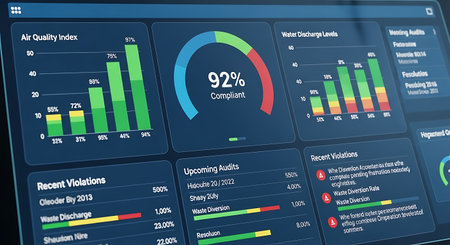
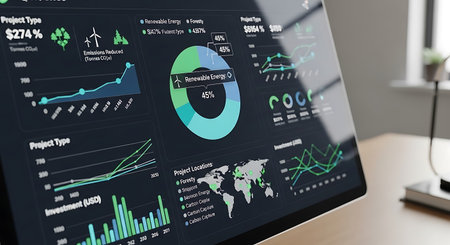
a digital dashboard showing air quality water discharge and compliance with data visualization and statistics
Коллекция по умолчанию
Коллекция по умолчанию
Создать новую
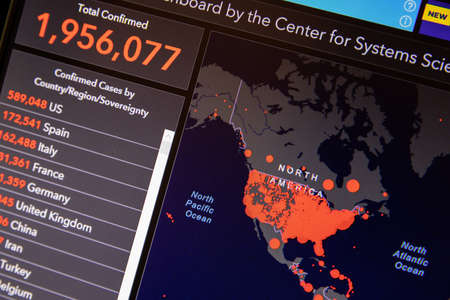
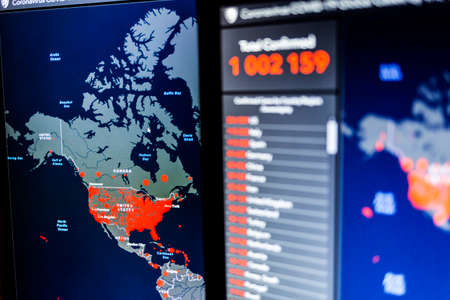
Over 1 million. Number of Total Confirmed Cases. Expert point Coronavirus COVID-19 global cases Map Johns Hopkins University map on monitor display.
Коллекция по умолчанию
Коллекция по умолчанию
Создать новую
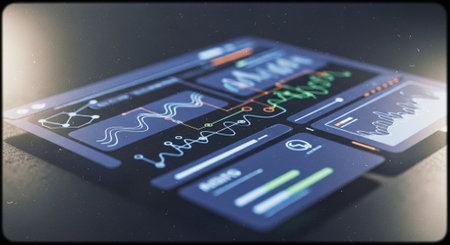
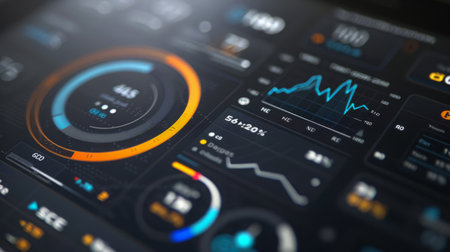
Futuristic interface display with charts and graphs. 3D rendering
Коллекция по умолчанию
Коллекция по умолчанию
Создать новую
Futuristic touch user interface. 3d rendering toned image
Коллекция по умолчанию
Коллекция по умолчанию
Создать новую
Close Up Of A Digital Display Showing Data And Charts
Коллекция по умолчанию
Коллекция по умолчанию
Создать новую
Global e-commerce dashboard displaying sales analytics, close-up of charts and graphs.
Коллекция по умолчанию
Коллекция по умолчанию
Создать новую
An AI-powered supply chain data analytics system, showing inventory levels, logistics metrics, and demand forecasts. This image emphasizes the role of AI in supply chain management.
Коллекция по умолчанию
Коллекция по умолчанию
Создать новую
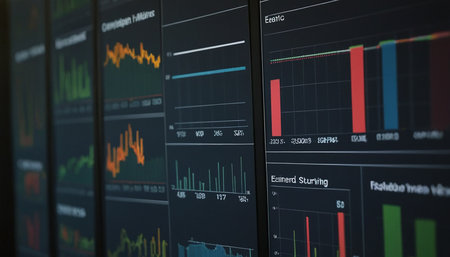
A modern digital interface featuring various data visualizations and graphs designed for analytics and monitoring, set against a dark background.
Коллекция по умолчанию
Коллекция по умолчанию
Создать новую
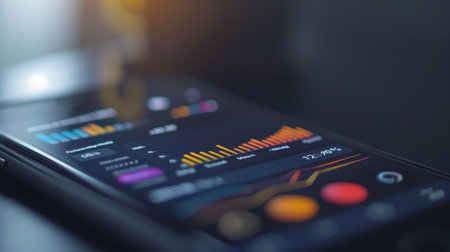
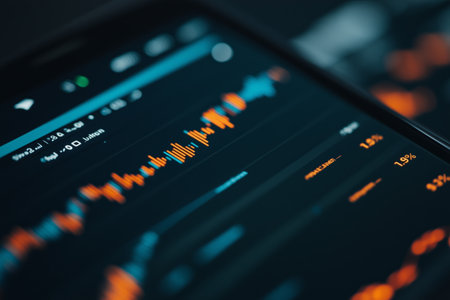
A close-up of a smartphone screen showing a financial app with graphs tracking investment performance and market trends.
Коллекция по умолчанию
Коллекция по умолчанию
Создать новую
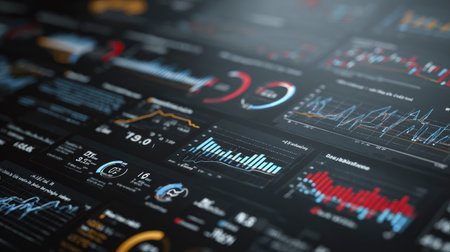
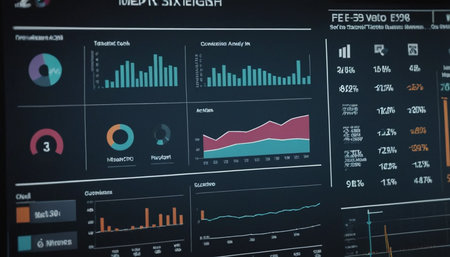
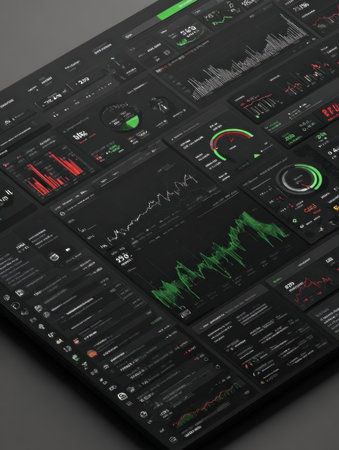
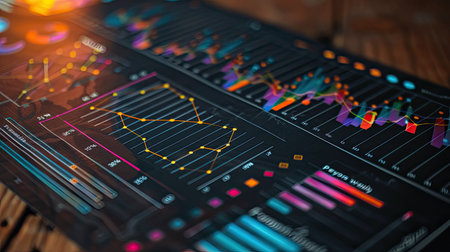
This image features an intricate layout of modern data visualizations, showcasing various colorful graphs and charts ideal for business analytics and performance reviews.
Коллекция по умолчанию
Коллекция по умолчанию
Создать новую
Stock market data on monitor. Financial graph on monitor. Stock market data on monitor. Stock market data on monitor. Business graph on monitor. Stock market data on monitor.
Коллекция по умолчанию
Коллекция по умолчанию
Создать новую
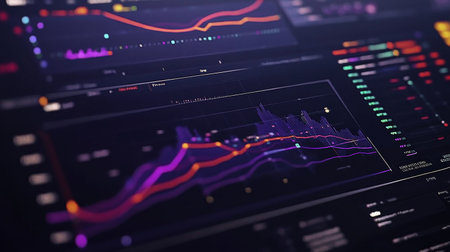
Explore a striking digital landscape showcasing intricate data visualizations. This image features vibrant graphs, charts, and metrics that convey powerful insights and trends in technology and business analytics.
Коллекция по умолчанию
Коллекция по умолчанию
Создать новую
Stock Market Chart on Blue Background. share drop down and stock up
Коллекция по умолчанию
Коллекция по умолчанию
Создать новую
Shopee data dashboard showcasing trend indicators, sales performance, and pie charts on a dark interface, with ample room for copy.
Коллекция по умолчанию
Коллекция по умолчанию
Создать новую
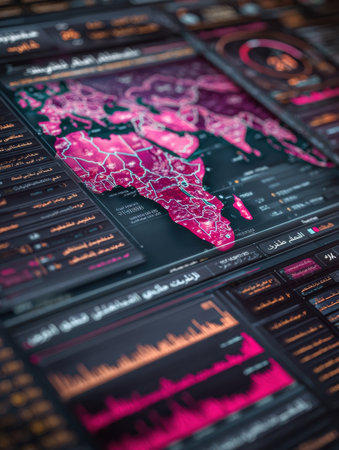
Digital map highlights geographical data with visual analytics, emphasizing key statistics and trends in a tech-driven environment, likely in an office.
Коллекция по умолчанию
Коллекция по умолчанию
Создать новую

Man using laptop at table, closeup. Scale showing level of risk
Коллекция по умолчанию
Коллекция по умолчанию
Создать новую
Closeup of modern computer monitor with world map. Global business concept.
Коллекция по умолчанию
Коллекция по умолчанию
Создать новую
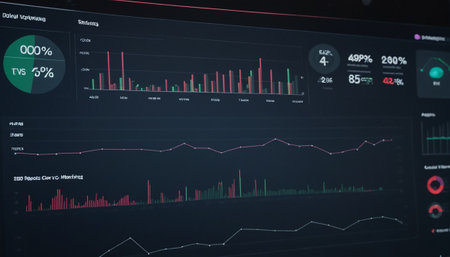
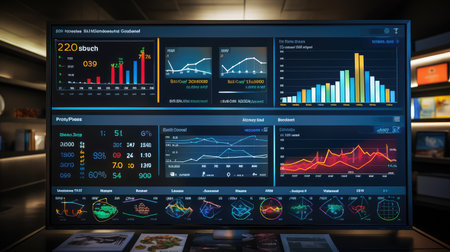
Vibrant data dashboard showcasing various analytical metrics and graphs for business analysis, illustrating the power of data visualization in decision-making processes.
Коллекция по умолчанию
Коллекция по умолчанию
Создать новую
Hand holding and turning risk know from low to middle and high level meter scale from risk management analysis of business and investment concept.
Коллекция по умолчанию
Коллекция по умолчанию
Создать новую
Futuristic screen with charts and graphs. 3d rendering.
Коллекция по умолчанию
Коллекция по умолчанию
Создать новую
A close-up of a financial dashboard with growth charts and profit reports, providing space to add insights on economic growth, investment strategies, or market expansion
Коллекция по умолчанию
Коллекция по умолчанию
Создать новую
Close-up of a monitor with a stock market data on it.
Коллекция по умолчанию
Коллекция по умолчанию
Создать новую

Stock market graph on screen. Ticker on monitor screen. Investing, Finance and Economic concept. Shallow depth of field.
Коллекция по умолчанию
Коллекция по умолчанию
Создать новую
Over 1 million. Number of Total Confirmed Cases. Coronavirus COVID-19 global cases Map Johns Hopkins University map on monitor display.
Коллекция по умолчанию
Коллекция по умолчанию
Создать новую

Bishkek, Kyrgyzstan - March 14, 2020: Discord voice communication app for remote work or study.
Коллекция по умолчанию
Коллекция по умолчанию
Создать новую
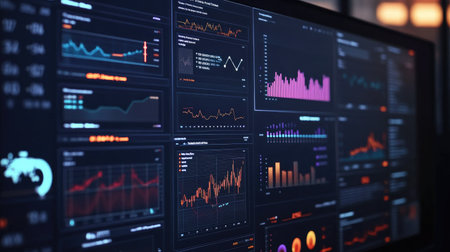
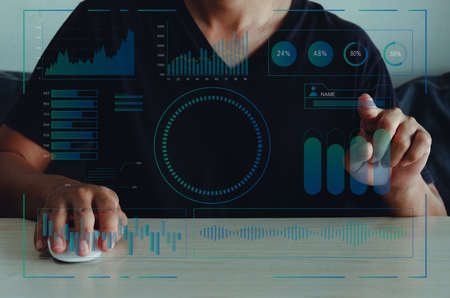
Data Analytics Stock market Business insights Graphs shown on monitor for strategic decisions in office today
Коллекция по умолчанию
Коллекция по умолчанию
Создать новую

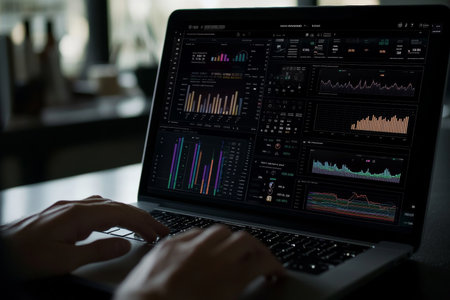
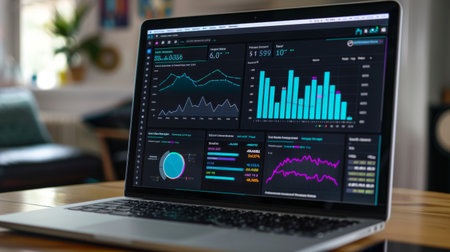
Glowing data charts displayed on a laptop signify analysis in a contemporary office setting during evening hours.
Коллекция по умолчанию
Коллекция по умолчанию
Создать новую

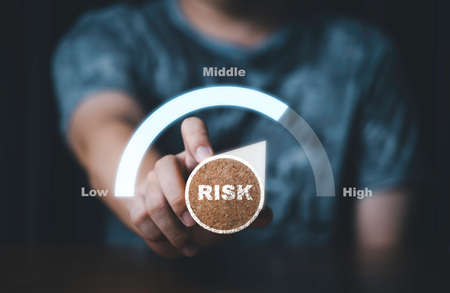
A person's outstretched hand holds a semi-circular risk meter. The meter displays a dial indicating a position between Low and High risk, with a glowing indicator. Icons representing business processes, security, and teamwork are connected around the meter. The background features blurred bokeh lights, creating a sense of depth and focus on the risk assessment concept.
Коллекция по умолчанию
Коллекция по умолчанию
Создать новую
Stunning abstract data visualization featuring colorful graphs and charts. Ideal for illustrating statistics, analysis, or technology concepts in modern contexts.
Коллекция по умолчанию
Коллекция по умолчанию
Создать новую
A focused shot of a large screen featuring realtime data visualization tools showcasing interactive segments filled with KPIs and metrics. The screen highlights areas of performanc
Коллекция по умолчанию
Коллекция по умолчанию
Создать новую
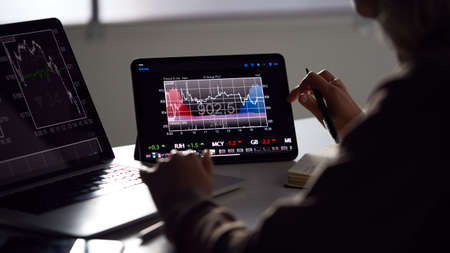
Close Up Of Female Share Trader At Desk With Stock Price Data Displayed On Laptop And Digital Tablet
Коллекция по умолчанию
Коллекция по умолчанию
Создать новую
Dynamic financial dashboard displays various metrics, charts, and analytics for market performance, capturing live changes in stock and cryptocurrency values.
Коллекция по умолчанию
Коллекция по умолчанию
Создать новую
Business statistics and Analytics value . Abstract glowing forex chart interface background. Investment, trade, stock, finance and analysis concept.
Коллекция по умолчанию
Коллекция по умолчанию
Создать новую
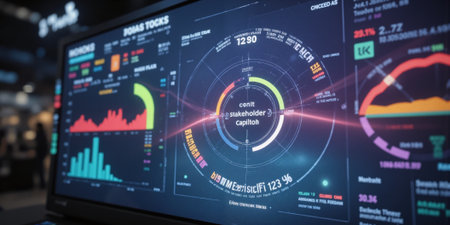
Unleashing Business Insights: Exploring a Virtual Screen with an Interactive Business Intelligence Analyst Dashboard and Spectacular Big Data Graphs and Charts
Коллекция по умолчанию
Коллекция по умолчанию
Создать новую
A Line Graph Illustrates the Rewards of Long-Term Investment
Коллекция по умолчанию
Коллекция по умолчанию
Создать новую
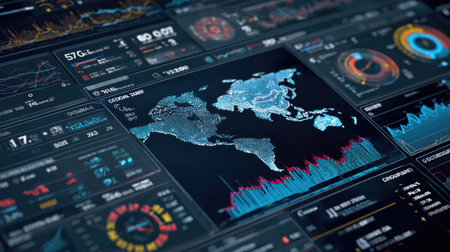
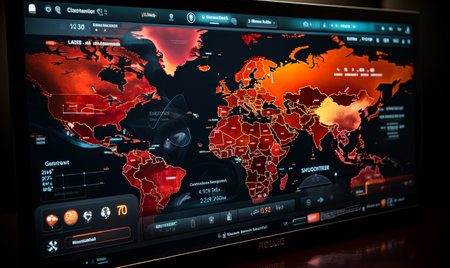
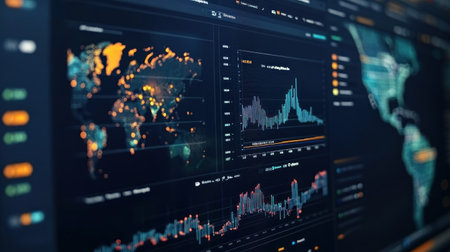
Futuristic digital representation featuring a world map surrounded by detailed graphs and data analytics, highlighting the importance of technology in business decisions.
Коллекция по умолчанию
Коллекция по умолчанию
Создать новую
demographics retail data
Коллекция по умолчанию
Коллекция по умолчанию
Создать новую

Over 1 million. Number of Total Confirmed Cases. Coronavirus COVID-19 global cases Map Johns Hopkins University map on monitor display.
Коллекция по умолчанию
Коллекция по умолчанию
Создать новую
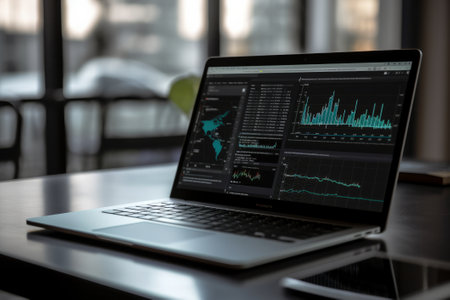
Close-up view of laptop screen with graphs and charts on screen
Коллекция по умолчанию
Коллекция по умолчанию
Создать новую
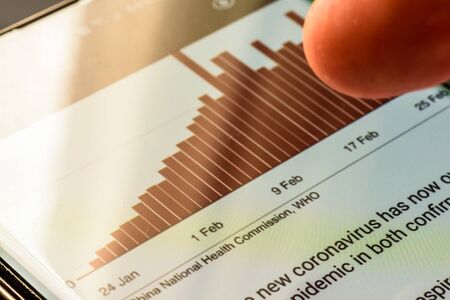
coronavirus covid 19 graph on smart phone screen - Northampton, UK - February 25, 2020
Коллекция по умолчанию
Коллекция по умолчанию
Создать новую
A close-up view of a digital dashboard showcasing various data visualizations. This image features colorful graphs and charts, ideal for illustrating analytics and performance insights in a modern workspace.
Коллекция по умолчанию
Коллекция по умолчанию
Создать новую
A detailed shot of a smart home dashboard monitoring energy and water usage, illustrating technology-driven sustainable living,
Коллекция по умолчанию
Коллекция по умолчанию
Создать новую
Digitally generated image of financial charts and graphs against black background
Коллекция по умолчанию
Коллекция по умолчанию
Создать новую
Wooden cubes with WEB 3.0 symbol on background and copy space.Business concepts.
Коллекция по умолчанию
Коллекция по умолчанию
Создать новую
Professional using laptop with virtual screens for financial analysis in modern office setting
Коллекция по умолчанию
Коллекция по умолчанию
Создать новую
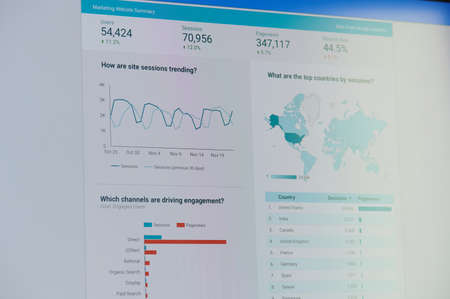
New york, USA - November 24, 2020: Google ads marketing website summarydashboard on laptop screen
Коллекция по умолчанию
Коллекция по умолчанию
Создать новую

The multinational hands of youth.
Коллекция по умолчанию
Коллекция по умолчанию
Создать новую

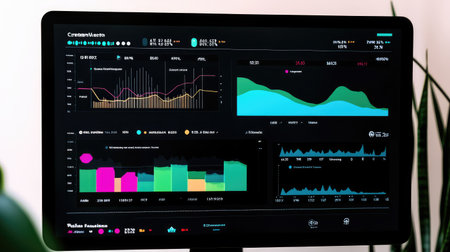
This image showcases a modern data visualization setup on a digital dashboard, featuring vibrant charts and dynamic graphs that illustrate analytics and business insights.
Коллекция по умолчанию
Коллекция по умолчанию
Создать новую
Close-up of a laptop screen with a dashboard displaying various graphs and charts, highlighting data visualization
Коллекция по умолчанию
Коллекция по умолчанию
Создать новую

Businessman touching to colorful risk scale indicator and analysis for evaluation business investment risk before decision and judgment concept.
Коллекция по умолчанию
Коллекция по умолчанию
Создать новую
Stock market data on monitor. Business financial graph on monitor. Stock market data on monitor screen. Business financial graph on monitor. Stock market data on monitor.
Коллекция по умолчанию
Коллекция по умолчанию
Создать новую
View of a Business data displayed on a futuristic interface - 3d rendering
Коллекция по умолчанию
Коллекция по умолчанию
Создать новую
A detailed image of a 3D bar graph with animated bars, capturing the data's fluctuations and trends, with interactive elements and labels for an advanced presentation.
Коллекция по умолчанию
Коллекция по умолчанию
Создать новую
Close up image of content displayed on a digital screen, representing digital media, information sharing, and online communication.
Коллекция по умолчанию
Коллекция по умолчанию
Создать новую

Business success and growth concept.Stock market business graph chart on digital screen. Stock trading, crypto currency background.
Коллекция по умолчанию
Коллекция по умолчанию
Создать новую

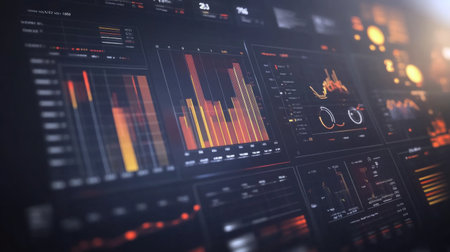
Explore a high-tech data dashboard featuring sleek graphs and charts that enhance business intelligence and performance monitoring with innovative visual analytics.
Коллекция по умолчанию
Коллекция по умолчанию
Создать новую

A closeup of a sophisticated digital screen filled with various data visualizations including predictive maintenance schedules and output forecasts showcasing a network of AI insights
Коллекция по умолчанию
Коллекция по умолчанию
Создать новую
Close up of a vibrant financial data dashboard with dynamic charts and graphs on a digital screen
Коллекция по умолчанию
Коллекция по умолчанию
Создать новую
A digital screen showcases a crypto gambling dashboard featuring glowing statistics and analytics, organized in vibrant graphs for live tracking.
Коллекция по умолчанию
Коллекция по умолчанию
Создать новую
This image showcases a futuristic control panel featuring vibrant graphs and data visualizations, emphasizing technology and modern workspace functionality.
Коллекция по умолчанию
Коллекция по умолчанию
Создать новую

Stock Market Trading Chart Investment Analysis Business Index Chart Finance Board Chart
Коллекция по умолчанию
Коллекция по умолчанию
Создать новую
Modern data visualization displayed on a large screen showcases graphs and charts reflecting financial performance metrics in a contemporary office setting.
Коллекция по умолчанию
Коллекция по умолчанию
Создать новую

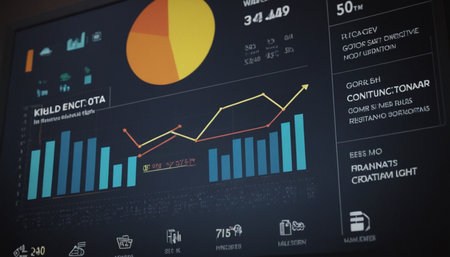
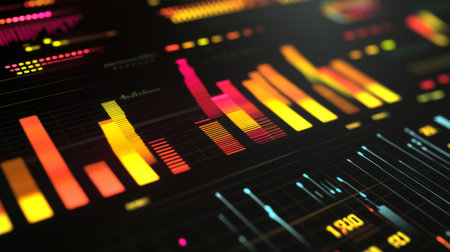
A colorful display of numbers and symbols on a screen. The colors are bright and vibrant, creating a sense of energy and excitement. The image could be related to finance, technology
Коллекция по умолчанию
Коллекция по умолчанию
Создать новую
Stock market data on LED screen. Abstract stock market data on LED. Stock market data on LED background. Abstract stock market data on LED. Global financial graph analysis concept.
Коллекция по умолчанию
Коллекция по умолчанию
Создать новую
Analytics dashboard showcasing dynamic data trends on a smartphone screen during evening analysis session
Коллекция по умолчанию
Коллекция по умолчанию
Создать новую

Tyumen, Russia - JULY 18, 2019: Cryptocurrency exchange mobile trading Bitcoin. Blur effect
Коллекция по умолчанию
Коллекция по умолчанию
Создать новую
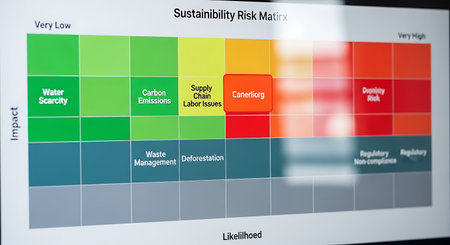
a sustainability risk matrix displays environmental impacts and likelihoods on a color coded chart.
Коллекция по умолчанию
Коллекция по умолчанию
Создать новую
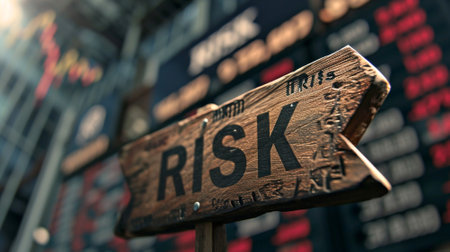
wooden sign with the word RISK, stock market exchange background
Коллекция по умолчанию
Коллекция по умолчанию
Создать новую
Change the stock market chart. The fall in the value of cryptocurrencies. Brokerage data
Коллекция по умолчанию
Коллекция по умолчанию
Создать новую

A close up of a red button that says risk on it, AI
Коллекция по умолчанию
Коллекция по умолчанию
Создать новую
Real time stock sales statistics with global hedge fund on monitor, trade exchange numbers changing after buying and selling money. Financial investment with profit. Close up. Tripod shot.
Коллекция по умолчанию
Коллекция по умолчанию
Создать новую
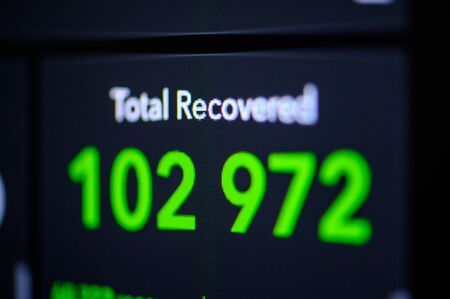
Green Number of Total Recovered from . Coronavirus COVID-19 global cases Map. Red Dot showing the number of infected. Johns Hopkins University map on monitor display.
Коллекция по умолчанию
Коллекция по умолчанию
Создать новую
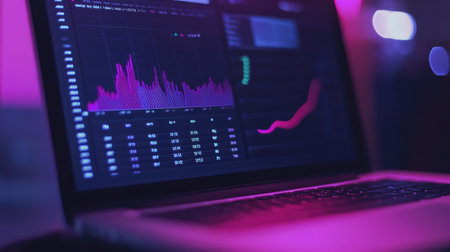
A focused view of a laptop displaying abstract financial data visualizations in a dim environment illuminated by purple lighting. Ideal for finance and tech visuals.
Коллекция по умолчанию
Коллекция по умолчанию
Создать новую
Stock market data on LED screen. Finance and trade concept. 3D Rendering
Коллекция по умолчанию
Коллекция по умолчанию
Создать новую
Strategic business planning for 2025 with graphs and financial data, highlighting new year goals and growth.
Коллекция по умолчанию
Коллекция по умолчанию
Создать новую
Female doctor worked around the clock to save lives. Doctor cry and feel unhappy with covid-19 rapid spread and growing number of deaths. Nurse watching TV news about coronavirus. Exhausted doctor
Коллекция по умолчанию
Коллекция по умолчанию
Создать новую
Legion-Media
Создайте свои проекты на основе качественных стоковых фотографий и видео.


Copyright © Legion-Media.